
In a post on X, @PawelHuryn describes an experiment that deliberately consumed part of several AI coding plans’ weekly allowances, logged the model calls and priced them at the vendors’ public API rates. The resulting subscription multipliers suggest that some plans can provide substantially more API-priced usage than their monthly fees would buy directly—but the figures describe particular models, clients, workloads and usage windows, not universal savings.
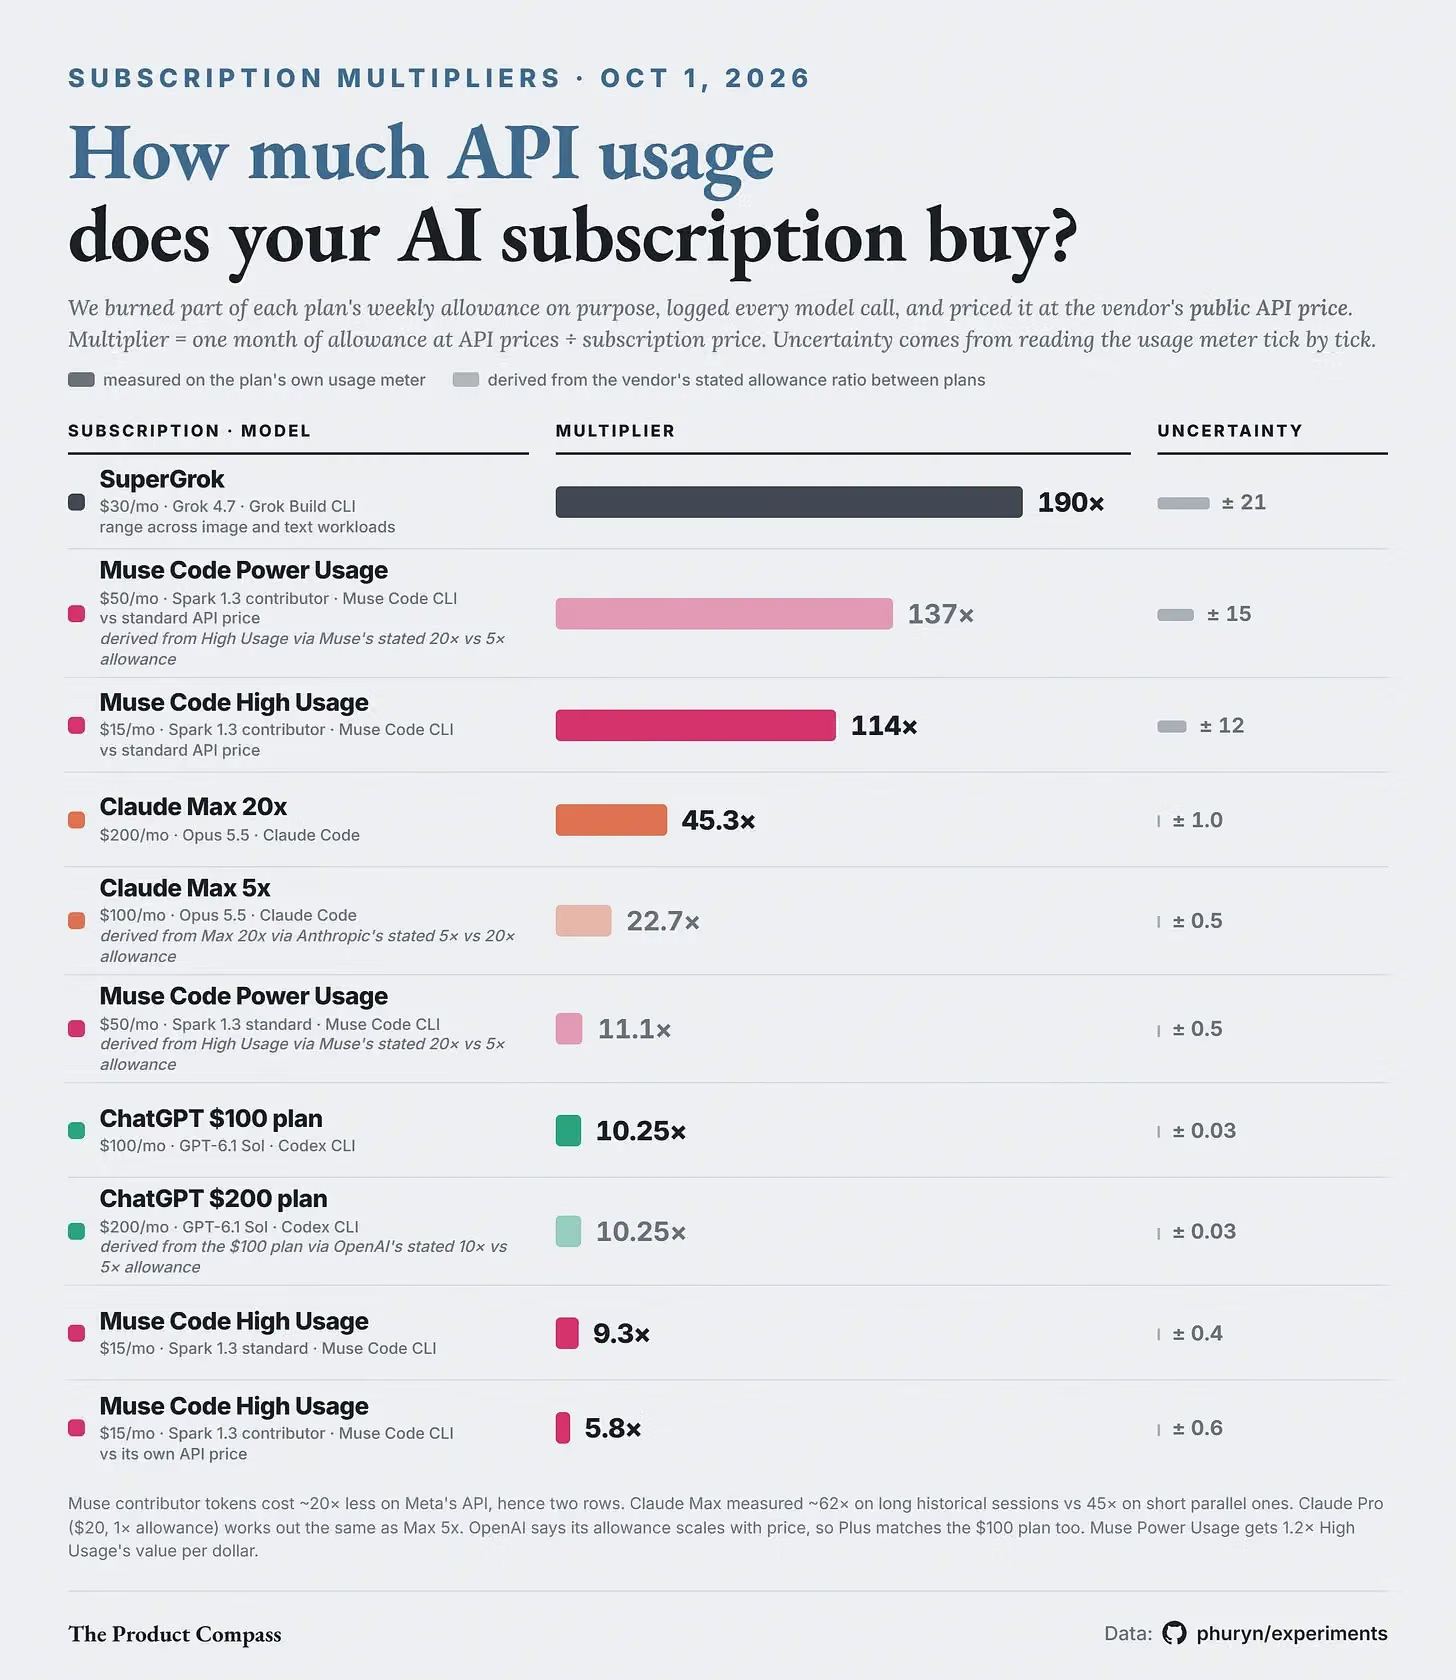
Image credit: @PawelHuryn on X
What the subscription multiplier means
The experiment defines a subscription multiplier as the estimated API cost of one month of a plan’s allowance divided by that plan’s monthly subscription price. A result of 10× therefore means the measured allowance would cost about 10 times the subscription fee at the selected model’s public API prices.
That calculation is different from saying that every subscriber will receive 10 times as much useful work, or that the subscription is always cheaper than API access. API prices vary by model and token type, while subscription systems meter usage through their own allowance rules. The multiplier also assumes that a user can consume the full allowance.
How the experiment measured API-equivalent value
The experiment used each service’s weekly usage meter and read the meter as it changed during a controlled run. Huryn logged model calls from the relevant client, then priced input, output and cached tokens using public API list prices for the model that handled each call.
The repository describes the reported uncertainty as a bracket caused by reading whole-percentage meter steps. It counts only complete steps between meter ticks, calculates lower and upper spending bounds for those steps, and reports the midpoint with half the bracket width as the uncertainty. The tests were run separately, with other use of each plan paused.
The record says each plan had one run and only two to six full meter steps. That makes the brackets useful for describing the recorded run, but they do not show that a vendor’s meter will behave the same way next week or across every subscriber’s workload.
Reported results
The table below uses the values in the supplied experiment repository. “Measured” means the plan’s own meter was tested. “Derived” means the value was calculated from a stated allowance relationship rather than directly tested.
Plan and model/client | Monthly price | API-equivalent multiplier | Uncertainty | Evidence status and pricing basis |
|---|---|---|---|---|
SuperGrok · Grok 4.7 · Grok Build CLI | $30 | 190× | ±21 | Measured; range across image and text workloads |
Muse Code Power Usage · Spark 1.3 contributor · Muse Code CLI | $50 | 137× | ±15 | Derived from stated allowance ratios; standard API pricing |
Muse Code High Usage · Spark 1.3 contributor · Muse Code CLI | $15 | 114× | ±12 | Measured against standard API pricing |
Claude Max 20x · Opus 5.5 · Claude Code | $200 | 45.3× | ±1.0 | Measured; short parallel read-only sessions |
Muse Code Power Usage · Spark 1.3 standard · Muse Code CLI | $50 | 11.1× | ±0.5 | Derived from stated allowance ratios; standard API pricing |
ChatGPT $100 plan · GPT-6.1 Sol · Codex CLI | $100 | 10.25× | ±0.03 | Measured |
ChatGPT $200 plan · GPT-6.1 Sol · Codex CLI | $200 | 10.25× | ±0.03 | Derived from OpenAI’s stated allowance scaling |
Muse Code High Usage · Spark 1.3 standard · Muse Code CLI | $15 | 9.3× | ±0.4 | Measured against standard API pricing |
Muse Code High Usage · Spark 1.3 contributor · Muse Code CLI | $15 | 5.8× | ±0.6 | Measured against contributor API pricing |
Image credit: @PawelHuryn on X
On the tested workloads, SuperGrok produced the largest reported multiplier: 190×, with the repository describing image work at roughly 170× and cache-heavy text work at roughly 200×. The highest Muse Code contributor comparison in the table is the derived Power Usage result at 137× against standard API pricing; the directly measured High Usage result was 114×. Claude Max 20x measured 45.3×, while the ChatGPT $100 plan measured 10.25×.
Those rows do not form a universal league table. SuperGrok’s result combines image and text workloads, Claude’s run used six parallel read-only sessions, and the ChatGPT result used GPT-6.1 Sol through Codex CLI. A multiplier comparison is meaningful only alongside the model, client, task and API price basis used to calculate it.
Which rows are derived rather than directly measured?
The repository derives the ChatGPT $200 result from OpenAI’s stated allowance scaling: the $100 plan is treated as five times the reference allowance and the $200 plan as 10 times that allowance. Under that assumption, both plans have the same 10.25× multiplier because the allowance and subscription price scale together.
Muse Code Power Usage is also derived. The supplied record says Meta describes High Usage as five times the Everyday Usage allowance and Power Usage as 20 times the base. That makes Power Usage four times High Usage’s allowance for 3.33 times the price, producing the derived 11.1× standard-API result and 137× contributor-versus-standard-API result.
These are calculations from stated ratios, not additional meter experiments. The source specifically removed an earlier Claude Max 5x row. Anthropic’s “5x” and “20x” figures refer to a five-hour usage window, while the experiment measures a weekly allowance and the supplied evidence does not provide the necessary weekly relationship. The Max 20x result remains because that plan was directly measured.
Why the ranking changes with workload and pricing
The experiment’s own caveats explain why the same subscription can produce different multipliers. Vendors do not meter usage directly in API dollars. A workload with long prompts, large outputs, image inputs or different cache behavior can consume the allowance at a different rate from a short coding task.
SuperGrok illustrates that variation: its reported result spans approximately 170× for image work and 200× for text work. Claude Max 20x measured about 45× during short parallel sessions, while older historical sessions were around 62× when cache reads represented more of the API-equivalent cost. The historical value was not included in the table because the meter may have changed.
Muse Code needs an additional pricing qualification. The contributor comparison is 114× against standard API prices but 5.8× against the contributor API’s own prices. Those are different denominators, not contradictory measurements. The contributor model has cheaper API prices, so the same subscription allowance looks much less subsidized when compared with that cheaper API.
The five-hour window matters too. The repository says Claude and Muse have five-hour limits in addition to their weekly allowances, and that the window binds particularly hard for Muse standard in the reported testing. A plan can look valuable over a full month while still interrupting a user who needs a large burst of work inside one short window.
Model efficiency can matter more than the multiplier
A lower subscription multiplier does not automatically mean less useful coding work. A more token-efficient model may solve a task with fewer turns, less reasoning and less output, reducing the API-equivalent cost of the task.
Huryn’s related benchmark compares planted-bug results with run cost and turn count rather than treating the subscription multiplier as a quality score. In the supplied discussion, GPT-6.1 Sol is described as catching up with a lower multiplier because it used fewer turns, less thinking and fewer output tokens on the tested work. That is an observation from the supplied benchmark context, not a general quality verdict across coding tasks.
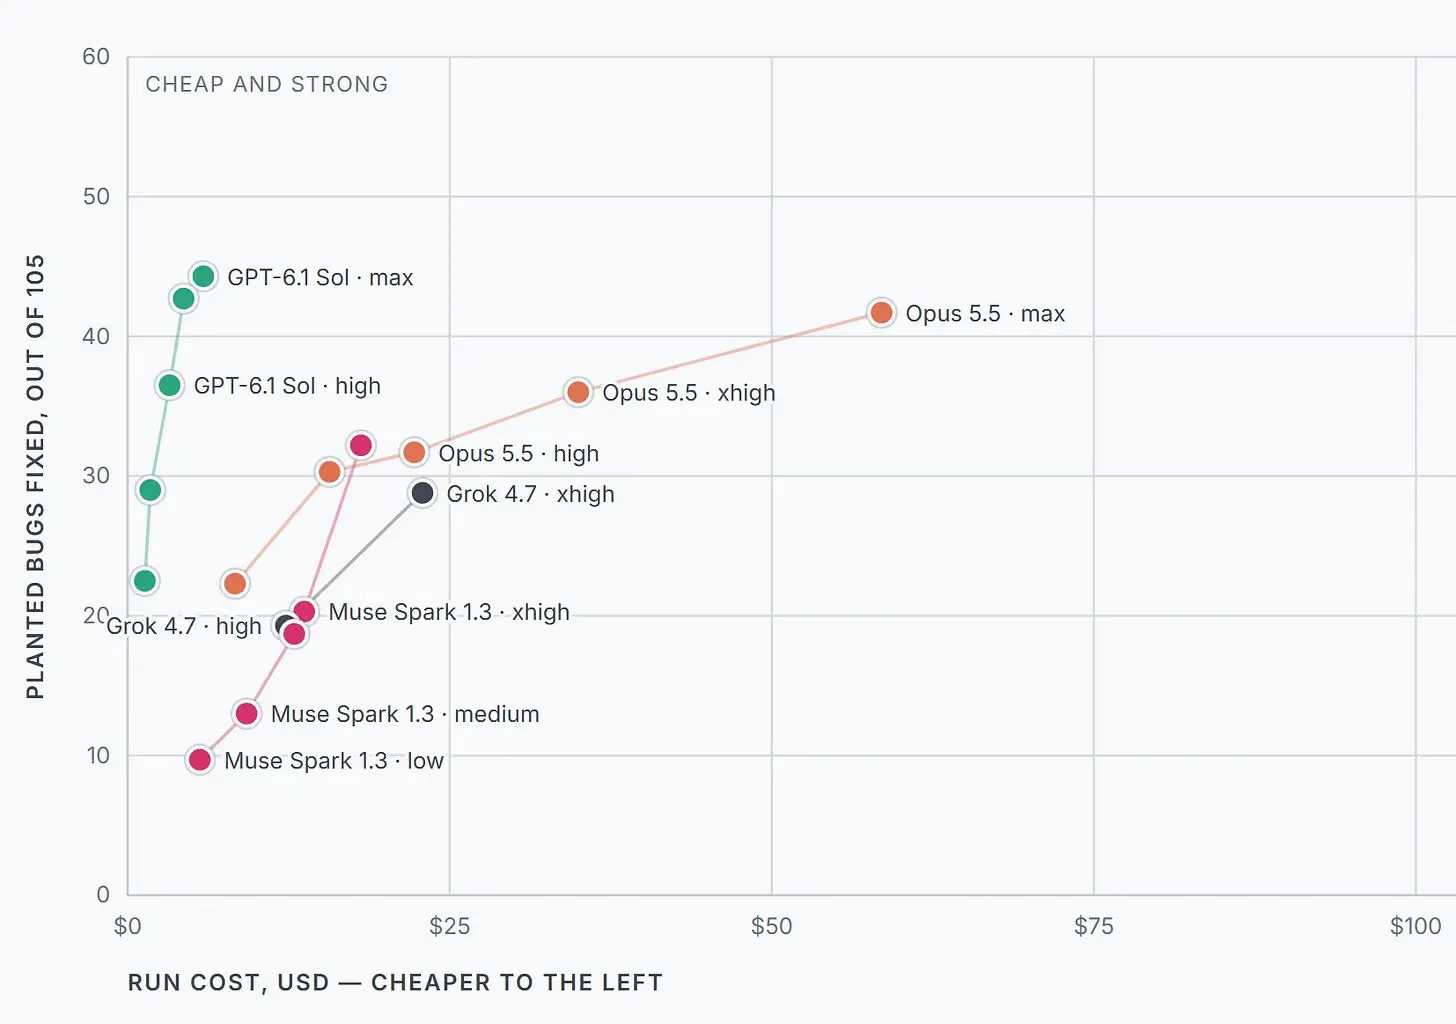
Image credit: @PawelHuryn on X
How to use the results when choosing a plan
Treat the table as a starting point for a workload-specific estimate:
Identify the model and client you would actually use, such as Grok Build CLI, Claude Code or Codex CLI.
Check whether the comparison uses standard API pricing or a special contributor price.
Consider whether your work is cache-heavy, image-heavy, bursty or spread across the full week.
Check both the weekly allowance and any five-hour limit.
Separate directly measured rows from values derived from vendor-stated ratios.
Treat the uncertainty bracket as uncertainty in that run, not as a guarantee of future plan behavior.
The experiment is most useful for showing the size of the possible difference between subscription pricing and API list pricing under particular conditions. It does not establish current plan availability, verify that vendors will retain the same prices or limits, measure every subscription tier, or provide an apples-to-apples quality comparison.
For a buyer, the practical question is therefore not simply which plan has the largest multiplier. It is whether the plan’s model, context limits, allowance window, privacy terms and workflow fit the work you expect to do. The full logs, scripts and caveats are available in the subscription-multipliers experiment repository, while the broader explanation appears in Huryn’s Product Compass analysis.

0 comments
No approved comments yet. You can start the conversation.
Leave a comment